
Introduction
The goal of the Soil Moisture Visualizer (SMV) is to bring together different soil moisture available for North America into a single platform for visualization. The visualizer harmonizes surface and root zone soil moisture data sets from multitude of sources that are in diverse native data formats and encompassing a range of spatial footprints, soil depths and measurement frequencies. The SMV consists of a web-based application for visualization of the soil moisture data and accompanying REST-based services (being developed) for accessing visualization and the data.
Navigation

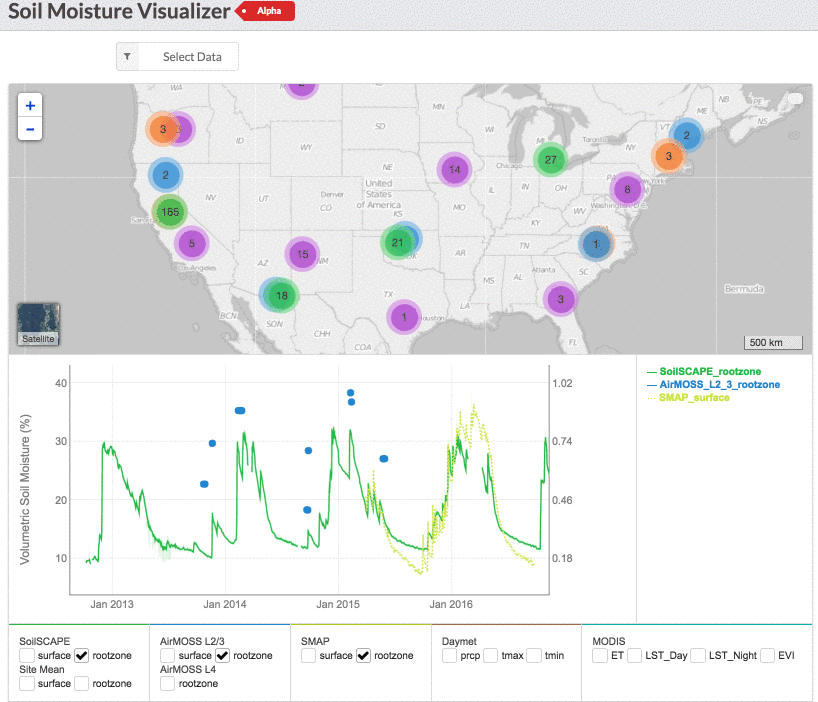
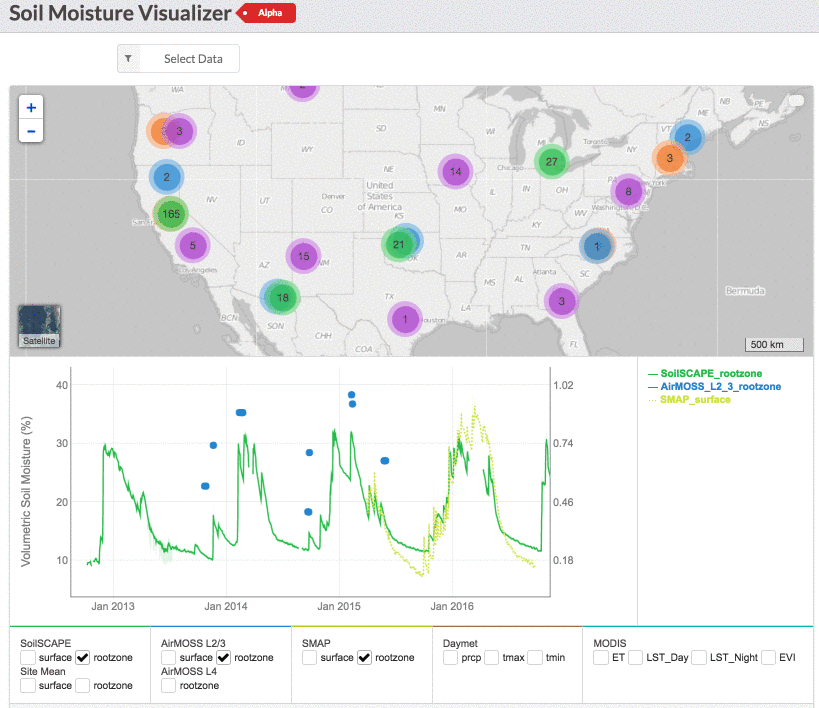
The visualizer page is divided into 3 sections: (1) the top menu bar section for data selection, (2) the central section for data visualization in interactive map and chart, and (3) the bottom data source section providing dynamic links to the data used to create the visualization. Each data set is applied a specific color throughout the visualization page.
A user can start visualization either by selecting the data from the top menu bar or by simply clicking on the colored-dots (representing soil moisture collection datasets) to display the chart. For SMAP data sets, there is an option to input longitude and latitude of a point on the menu bar, or the user can alternatively move the yellow marker to a different location to get visualization of SMAP data of the location.
- Map Interaction: Scroll to zoom, left-click and drag to pan, left-click on the colored markers to display the chart. To switch base layers, click the map image on the bottom-left corner. Currently three base layers are available: Google satellite image, Google terrain, and black-and-white map. The detailed information about the data is shown on the box on the top-right corner of the map.
- Chart Interaction: Click-drag to zoom, shift-click-drag to pan, double-click or left-click on "Reset Zoom" button (on top-left corner of the chart) to restore zoom level, hover the mouse pointer over lines to display values on the legend (on right side of the chart). Click checkboxes (below the chart) to turn on/off data display.
- Data Source: Each data source is displayed in a separate panels. Clicking on the "Info" button at the top-right corner opens the metadata (data description) page. The link at the buttom of the panel opens the data provider's website.
|
|
| Visualizing point data | Visualizing grid data |
Datasets
The visualization uses the L2/3 RZSM and in situ L2 IGSM data for AirMOSS, the L4 SPL4 (9 km) product for SMAP, the COSMOS level 3 soil moisture (SM12H), FLUXNET2015 for AmeriFlux soil moisture, GRACE Data Assimilation L4 Version 2 GRACE-DA-DM (0.125 degrees), SMAP SPL4CMDL for Net Ecosystem Exchange (NEE), MODIS products MOD16A2 (1 km) for evapotranspiration (ET), MOD13Q1 (0.25 km) for enhanced vegetation index (EVI), and MOD11A2 (1 km) for land surface temperature (LST), and the Daymet gridded data version 4. The visualization is expected to be updated weekly (every Sunday), but some data sets might have longer latency period set by the provider.
| Data Source | Citation | Soil depths | Frequency | Grid resolution | Time period |
|---|---|---|---|---|---|
| Soil Moisture Data | |||||
| AirMOSS L2/3 RZSM | [1] | 0, 10, 30 cm | >1 day | ~ 90m | 2012-2015 |
| AirMOSS L4 RZSM | [2] | 0-10, 10-40, 40-100 cm | 1 hour | ~ 90m | 2012-2015 |
| AirMOSS In Situ L2 IGSM | [3] | 2, 5, 10, 20, 40, 60, 80 cm | ~ 1 hour | Point | 2011-2015 |
| SoilSCAPE | [4] | 5, 20, 50 cm | ~ 20 min | Point | 2011-present |
| COSMOS | [5] | 0-30 cm | 1 hour | Point | 2008-present |
| SMAP L4 SM | [6] | 0-5, 0-100 cm | 3 hour | 9 km | 2015-present |
| GRACE-DA-DM | [7] | 0-2, 0-100 cm | 1 week | 0.125 degree | 2002-present |
| USCRN | [8] | 5, 10, 20, 50, 100 cm | 1 hour | Point | 2009-present |
| SCAN | [9] | 2, 4, 8, 20, 40 inches | 1 hour | Point | 1996-present |
| SNOTEL | [10] | 2, 4, 8, 20, 40 inches | 1 hour | Point | 1996-present |
| FLUXNET | [11] | 0-100 cm | 1 hour | Point | 1996-2015 |
| PBOH2O | [17] | 0-5 cm | 1 day | Point | 2006-2017 |
| Other Related Data | |||||
| SPL4CMDL | [12] | 1 day | 9 km | 2015-present | |
| Daymet | [13] | 8 day | 1000m | 2000-present | |
| MOD16A2 | [14] | 8 day | 500m | 2001-present | |
| MOD13Q1 | [15] | 16 day | 250m | 2000-present | |
| MOD11A2 | [16] | 8 day | 1000m | 2000-present | |
Data Aggregation
- Temporal: Currently, the visualizer displays all the available soil moisture
data as daily averages. This is done to bring uniformity among
the datasets available at different time intervals. If a finer temporal resolution
is required, the users can directly download the data from the
data source section and create their own visualization.

- Spatial aggregation and extent: For point
data visualization (e.g. soilscape nodes), the corresponding grid data
(e.g. SMAP) is the value from the grid underlying the point. Similarly,
for grid-data visualization, the corresponding point data is the average of
all the points located within the grid. Currently the visualizer only
displays the data from North American region (within the bounds of 8°N, 179°W
and 83°N, 52°W).

- Depth of measurements: When multiple measurements or
estimation of soil moisture exists for different depths, the surface soil
moisture is computed as the average of all the measurements from
0-5cm depth and the root zone soil moisture (RZSM) from 0-100cm depth.

Visualizing specific data sets
Specific data sets can be visualized directly using URL query parameters. Currently following parameters are available:
| Parameter | Options | Description | Optional | |
|---|---|---|---|---|
lon |
float | Longitude in decimal degrees | ||
lat |
float | Latitude in decimal degrees | ||
| AirMOSS L2/3 RZSM | ||||
fid |
integer | AirMOSS flight identifier | ||
date |
yyyymmdd | Flight date in YYYYMMDD format | ||
Examples: https://airmoss.ornl.gov/visualize/index.html?fid=13078&date=20130422:
Displays rootzone soil moisture image of the airMOSS flight ID 13078 and date 2013-04-22https://airmoss.ornl.gov/visualize/index.html?data=airmoss&lon=-79.10&lat=35.98:
Displays time series of airMOSS soil moisture data at coordinates (-79.10, 35.98), if available
|
||||
| SMAP L4 SM | ||||
Examples: https://airmoss.ornl.gov/visualize/index.html?data=smap&lon=-79.10&lat=35.98:
Displays time series of SMAP soil moisture data at coordinates (-79.10, 35.98), if available
|
||||
Downloading Data
The dataset used for visualization can be downloaded as a comma-separated text file. After siging in to the ORNL-DAAC, the download can be started by clicking "Download Data" button on the right-side of the chart.
The downloaded data will be either for the point-location (if the user is viewing SoilSCAPE, AirMOSS in-ground or COSMOS sites) or for 9-km grid (if the user is viewing AirMOSS or SMAP data) aggregated as daily averages. The user can not currently select specific column fields - all data for the given point or grid will be downloaded. The description of the column fields of the downloaded file is given below:
| Column fieldname | Description | Units |
|---|---|---|
SoilSCAPE_surface |
Mean volumetric (%) soil moisture at 0-5 cm soil depth | m3/m3 |
SoilSCAPE_rootzone |
Mean volumetric (%) soil moisture at 0-100 cm soil depth | m3/m3 |
AirMOSS_in-ground_surface |
Mean volumetric (%) soil moisture at 0-5 cm soil depth | m3/m3 |
AirMOSS_in-ground_rootzone |
Mean volumetric (%) soil moisture at 0-100 cm soil depth | m3/m3 |
COSMOS_surface |
Mean volumetric (%) soil moisture at 0-5 cm soil depth | m3/m3 |
COSMOS_rootzone |
Mean volumetric (%) soil moisture at 0-100 cm soil depth | m3/m3 |
AirMOSS_L2_3_surface |
Mean volumetric (%) soil moisture at 0 cm soil depth | m3/m3 |
AirMOSS_L2_3_rootzone |
Mean volumetric (%) soil moisture at 0-30cm soil depth | m3/m3 |
AirMOSS_L4_rootzone |
Mean volumetric (%) soil moisture at 0-100cm soil depth | m3/m3 |
SMAP_surface |
Mean volumetric (%) soil moisture at 0-5cm soil depth | m3/m3 |
SMAP_rootzone |
Mean volumetric (%) soil moisture at 0-100cm soil depth | m3/m3 |
NEE_mean |
Mean Net Ecosystem Exchange value | g C m-2d-1 |
GPP_mean |
Mean Gross Primary Productivity value | g C m-2d-1 |
GRACE_surface_pctl |
Surface soil moisture percentile | % |
GRACE_rootzone_pctl |
Root zone soil moisture percentile | % |
SCAN_surface |
Mean volumetric (%) soil moisture at 0-5 inches soil depth | m3/m3 |
SCAN_rootzone |
Mean volumetric (%) soil moisture at 0-40 inches soil depth | m3/m3 |
SNOTEL_surface |
Mean volumetric (%) soil moisture at 0-5 inches soil depth | m3/m3 |
SNOTEL_rootzone |
Mean volumetric (%) soil moisture at 0-40 inches soil depth | m3/m3 |
CRN_surface |
Mean volumetric (%) soil moisture at 0-5cm soil depth | m3/m3 |
CRN_rootzone |
Mean volumetric (%) soil moisture at 0-100cm soil depth | m3/m3 |
FLUXNET_surface |
Mean volumetric (%) soil moisture (upper layer) | m3/m3 |
FLUXNET_rootzone |
Mean volumetric (%) soil moisture (upper & lower layer) | m3/m3 |
PBOH2O_surface |
Volumetric (%) surface soil moisture | m3/m3 |
prcp |
Precipitation for 1 km x 1 km grid (Daymet) | mm/day |
tmax |
Maximum daily temperature for 1 km x 1 km grid (Daymet) | degrees C |
tmin |
Minimum daily temperature for 1 km x 1 km grid (Daymet) | degrees C |
ET |
Evapotranspiration (MODIS) | mm/8day |
LST-day |
Land Surface Temperature Day (MODIS) | K/8day |
LST-night |
Land Surface Temperature Night (MODIS) | K/8day |
EVI |
16 days Enhanced Vegetation Index (MODIS) |
Web Service
Web service for accessing visualization and data using RESTful api is being developed. This section will be updated soon.
Publication
- Shrestha, R., and A. G. Boyer. 2019. Soil moisture data sets become fertile ground for applications, Eos, 100, https://doi.org/10.1029/2019EO114329
Data Citations
- [1] Moghaddam, M., et al. 2016. AirMOSS: L2/3 Volumetric Soil Moisture Profiles Derived From Radar, 2012-2015. ORNL DAAC, Oak Ridge, Tennessee, USA. https://doi.org/10.3334/ORNLDAAC/1418
- [2] Crow, W.T., S. Milak, and R.H. Reichle. 2016. AirMOSS: L4 Modeled Volumetric Root Zone Soil Moisture, 2012-2015. ORNL DAAC, Oak Ridge, Tennessee, USA. https://doi.org/10.3334/ORNLDAAC/1421
- [3] Hagimoto, Y., R. Cuenca, and AirMOSS Science Team. 2016. AirMOSS: L2 Hourly In-Ground Soil Moisture at AirMOSS Sites, 2011-2015. ORNL DAAC, Oak Ridge, Tennessee, USA. https://doi.org/10.3334/ORNLDAAC/1416
- [4] Moghaddam, M., et al. 2017. Soil Moisture Profiles and Temperature Data from SoilSCAPE Sites, USA. ORNL DAAC, Oak Ridge, Tennessee, USA. https://doi.org/10.3334/ORNLDAAC/1339
- [5] Zreda, M., W. J. Shuttleworth, X. Zeng, C. Zweck, D. Desilets, T. Franz, and R. Rosolem. 2012. COSMOS: the COsmic-ray Soil Moisture Observing System. Hydrol. Earth Syst. Sci., 16, 4079-4099, https://doi.org/10.5194/hess-16-4079-2012.
- [6] Reichle, R., G. De Lannoy, R. D. Koster, W. T. Crow, J. S. Kimball, and Q. Liu. 2018. SMAP L4 Global 3-hourly 9 km EASE-Grid Surface and Root Zone Soil Moisture Analysis Update, Version 4. Boulder, Colorado USA. NASA National Snow and Ice Data Center Distributed Active Archive Center. https://doi.org/10.5067/60HB8VIP2T8W
- [7] Kumar, S. V., et al. 2016. Assimilation of gridded GRACE terrestrial water storage estimates in the North American Land Data Assimilation System. Journal of Hydrometeorology, 17, 1951-1972. https://doi.org/10.1175/jhm-d-15-0157.1.
- [8] Bell, J. E., et al. 2013. U.S. climate reference network soil moisture and temperature observations. Journal of Hydrometeorology, 14, 977-988. https://doi.org/10.1175/jhm-d-12-0146.1
- [9] Schaefer, G. L., M. H. Cosh, and T. J. Jackson, 2007. The USDA Natural Resources Conservation Service Soil Climate Analysis Network (SCAN). Journal of Atmospheric and Oceanic Technology, 24, 2073-2077. https://doi.org/10.1175/2007JTECHA930.1.
- [10] Serreze, M. C., M. P. Clark, R. L. Armstrong, D. A. McGinnis, and R. S. Pulwarty, 1999. Characteristics of the western United States snowpack from snowpack telemetry (SNOTEL) data. Water Resources Research, 35, 2145-2160. https://doi.org/10.1029/1999WR900090
- [11] Baldocchi, D., and Coauthors, 2001. FLUXNET: A new tool to study the temporal and spatial variability of ecosystem-scale carbon dioxide, water vapor, and energy flux densities. Bulletin of the American Meteorological Society, 82, 2415-2434. https://doi.org/10.1175/1520-0477(2001)082<2415:FANTTS>2.3.CO;2
- [12] Kimball, J. S., L. A. Jones, T. Kundig, and R. Reichle. 2018. SMAP L4 Global Daily 9 km EASE-Grid Carbon Net Ecosystem Exchange, Version 4. Boulder, Colorado USA. NASA National Snow and Ice Data Center Distributed Active Archive Center. https://doi.org/10.5067/9831N0JGVAF6
- [13] Thornton, M.M., R. Shrestha, Y. Wei, P.E. Thornton, and B.E. Wilson. 2020. Daymet: Daily Surface Weather Data on a 1-km Grid for North America, Version 4. ORNL DAAC, Oak Ridge, Tennessee, USA. https://doi.org/10.3334/ORNLDAAC/1840
- [14] Running, S., Mu, Q., Zhao, M. 2017. MOD16A2 MODIS/Terra Net Evapotranspiration 8-Day L4 Global 500m SIN Grid V006. NASA EOSDIS Land Processes DAAC. https://doi.org/10.5067/MODIS/MOD16A2.006
- [15] Didan, K. 2015. MOD13Q1 MODIS/Terra Vegetation Indices 16-Day L3 Global 250m SIN Grid V006. NASA EOSDIS Land Processes DAAC. https://doi.org/10.5067/MODIS/MOD13Q1.006
- [16] Wan, Z., Hook, S., Hulley, G. 2015. MOD11A2 MODIS/Terra Land Surface Temperature/Emissivity 8-Day L3 Global 1km SIN Grid V006. NASA EOSDIS Land Processes DAAC. https://doi.org/10.5067/MODIS/MOD11A2.006
- [17] Larson, K. M., Small, E. E., Gutmann, E. D., Bilich, A. L., Braun, J. J., and Zavorotny, V. U. 2008. Use of GPS receivers as a soil moisture network for water cycle studies. Geophys. Res. Lett., 35, L24405, https://doi.org/10.1029/2008GL036013.